Linear Regression — How to interpret model results?
Building a linear regression model looks simple, however, the whole story lies in understanding what independent variables would result in the best model. The way to go is to understand the model summary statistics.
We will investigate the reading test score example (part of MITx Analytics Edge course). It was requested to interpret students’ reading test scores given their race, gender, school size, education level of their parents and other parameters.
The general linear regression equation is considering one independent variable is:

Before we introduce the interpretation of model summary results, we will show the correlation of some independent variables to the reading test score (the label that we want to predict).

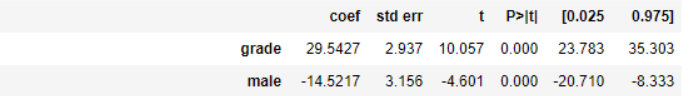
After applying a linear regression model using the Ordinary Least Square method (OLS) from python package “statsmodels.api”, we got the summary statistics as below.

The main metrics to look at are:
1- R-squared
R-squared represents the amount of the variation in the response (y) based on the selected independent variable or variables(x). Small R-squared means the selected x is not impacting y.
R-squared will always increase if you increase the number of independent variables in the model. On the other hand, Adjusted R-squared will decrease if you add an independent variable that does not help the model.
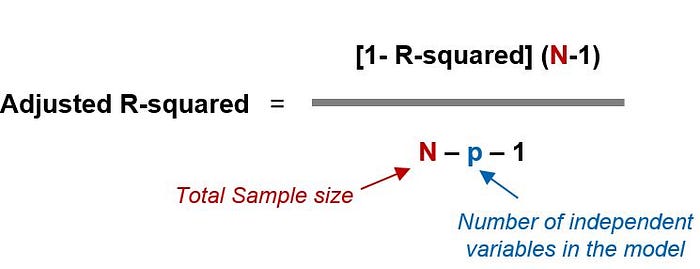
The most vital difference between adjusted R-squared and R-squared is simply that adjusted R-squared considers and tests different independent variables against the model and R-squared does not.[Investopidia]
2- Standard error
The standard error column represents the standard deviation of the selected independent variable divided by the square root of the sample size. When a sample is extracted from a population, their means will be different. The standard error accounts for the difference between the sample mean and the population mean. It is a measure dispersion of sample means around the population mean.
3- t-value
The t-value is the calculated coefficient for an independent variable divided by its standard error. The larger the absolute value of the t-value, the more likely the coefficient is to be significant.
4- P-value
It measures the statistical significance of each independent variable in the model. A low p-value (< 0.05) indicates that the variable is meaningful for the model and suggests that changes in the independent variable (predictor) are related to changes in the response variable (dependant variable).
5- Skew
Is a measurement of symmetry in our data, with 0 being perfect symmetry.
6- [0.025–0.975]
Is measurements of values in the coefficient within 95% of the data, or within two standard deviations. Outside of these values, the data points are outliers. Values in this column depend on the distribution of the parameter (coefficient).
Looking at our model summary results and investigating the “grade” variable, the parameters are as below:
- coefficient = 29.54
- standard error = 2.937
- t = 29.54/2.937 = 10.05
- p-value = 0.00 < 0.05 indicating significant of the grades variable to the model
- [0.025–0.975] shows that 95% of the grade independent variable data was between 23.783 and 35.303
In colclusion
Reading the summary statistics is essential to control the quality of the regression model through controlling the independent variables that go into building your model.
Pick independent variables that have high significance to the model. Independent variables of high t-value, low p-value, and does not decrease the adjusted R-squared.
The project work is available on Github.